H1 2026 Student Accommodation Finance Report
Selective capital. More demanding underwriting. A market shaped by the quality of income and the certainty of the exit.
UK sector analysis, with England and Wales sold-price context and an observed planning sample. H1 activity is separated from academic-year baselines, snapshot coverage and later outlook updates. Read the methodology.
Capital remains available. Income quality determines access.
H1 2026 was a period of concentrated investment activity and selective financing. The opportunity is to fund accommodation that students can afford, operators can manage and lenders can refinance.
The sector does not support a single growth narrative. Large transactions sustained first-half investment totals, but second-quarter trading slowed. Lenders continued to announce development, refurbishment and investment facilities. At the same time, operator results and demand indicators argue for more disciplined income and exit assumptions.
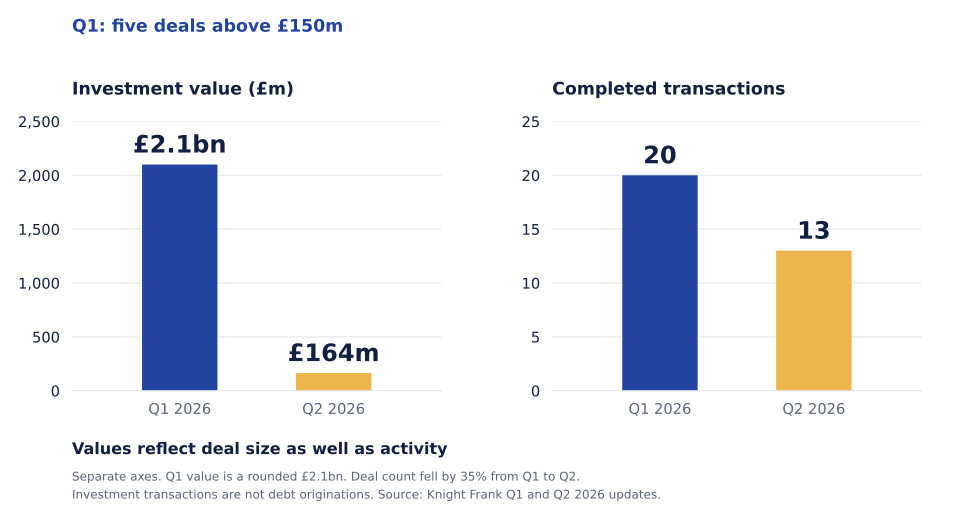
- Trading slowed through the half. Knight Frank recorded 33 H1 investment transactions: 20 in Q1 and 13 in Q2, a 35% quarterly fall in deal count. Its reported H1 volume was £2.3bn, with Q1 dominated by larger transactions.[M1],[M2]
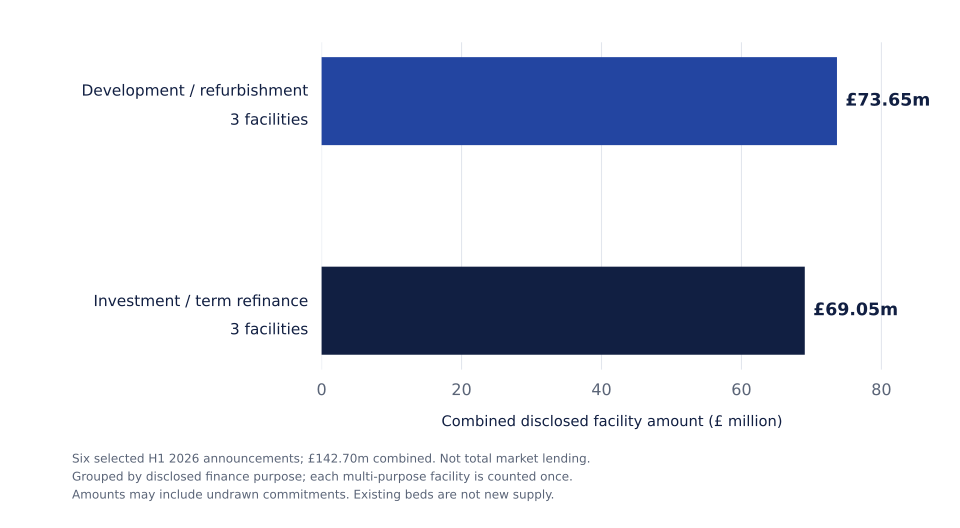
- Finance remained available across the asset lifecycle. Six selected H1 announcements reviewed for this report disclose £142.7m of facilities, spanning development, refurbishment and refinance. This is an illustrative sample, not a market lending total.[F1]
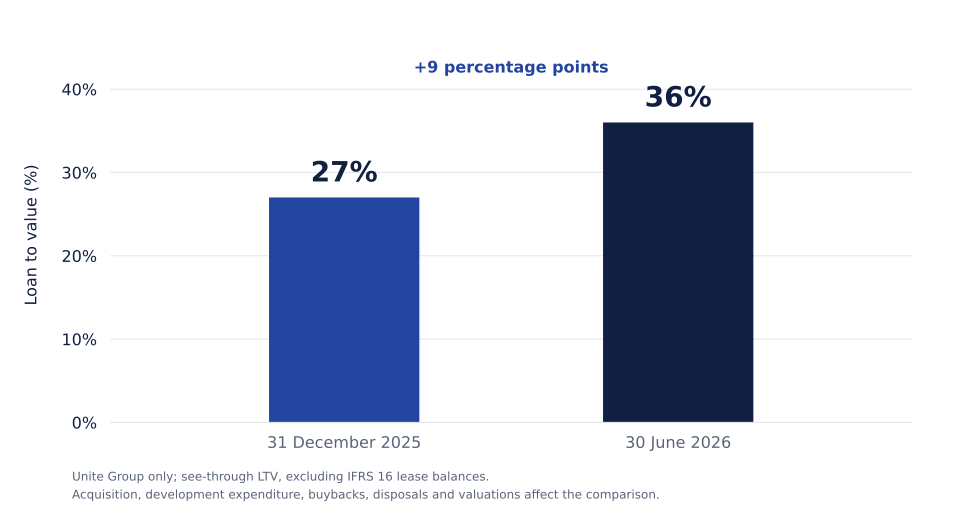
- Refinancing requires equity discipline. Unite’s see-through LTV moved from 27% at December 2025 to 36% at June 2026, during a half that included an acquisition and lower property valuations. The company illustrates the interaction of debt, portfolio changes and valuation; it is not a sector average.[O1]
- Underwrite distinct student markets. Rising international undergraduate applications sit alongside declining broader visa grants. Affordable shared housing, direct-let studios and university-backed halls have different demand and income risks.[D2],[D3]
For the remainder of 2026, the most defensible financing cases combine evidenced net income, a credible operator, sufficient equity and a clear route through the academic letting cycle. National demand indicators can frame an appraisal; they cannot substitute for asset-level occupancy, affordability and competing supply analysis.
Large Q1 deals amplified the quarterly change in investment value.
The reduction in investment value was much larger than the decline in deal count. Q1 is a concentrated comparison base, not a normalised run rate.
The published values imply a fall of roughly 92%, compared with a 35% reduction in deal count. Knight Frank identified five Q1 deals above £150m, including Unite’s acquisition of Empiric. Unite confirms that acquisition completed on 28 January. The series includes corporate acquisitions and forward-development structures; values reflect deal size and structure as well as the pace of trading. It is not a 92% fall in loan originations. No adjusted series is estimated without a complete, consistently valued deal ledger.[M1],[M2],[O3]
Value and deal count show the effect of Q1’s large transactions
UK PBSA investment (£ million) and completed transactions; separate scales. Q1 investment value is rounded.
View chart data
| Period | Investment value | Completed deals |
|---|---|---|
| Q1 2026 | £2.1bn (rounded) | 20 |
| Q2 2026 | £164m | 13 |
| H1 2026 | £2.3bn (reported) | 33 |
Of the 33 H1 deals, 21 involved operational assets, eight land and four joint ventures or forward funding. Q2’s 13 deals were below the five-year Q2 average of 17. Prime direct-let net initial yield indications moved from 4.50% to around 4.75% in London and from 5.25-5.50% to 5.50-5.75% in the regions between the two updates.[M1],[M2]
This pattern suggests greater selectivity over entry pricing and execution. A lower transaction count can reduce the depth of comparable evidence available to valuers. It does not establish that every city, operator or building experienced the same repricing.
| Source | H1 PBSA investment | Q2 PBSA investment |
|---|---|---|
| Knight Frank, 7 August | £2.3bn | £164m |
| JLL, 23 July | £2.3bn | £121m |
| CBRE, 15 July; preliminary | £1.9bn | £80m |
CBRE reported H1 growth of 66% against its own prior-year series. Differences in coverage, timing and definitions have not been reconciled here. We use Knight Frank consistently for the principal transaction series; the estimates are not averaged.[M2],[M3],[M4]
Finance supports both existing income and asset transformation.
The disclosed financing sample spans standing investment, refurbishment, new development and stabilisation. Aggregating by purpose shows the breadth of activity while retaining counterparty-level research privately.
Selected H1 facilities total £142.7m across two financing strategies
Six announcements, grouped by primary disclosed use. Each group contains three facilities; selected sample, not market coverage.
View chart data
| Financing strategy | Combined facilities (£m) | Facility count |
|---|---|---|
| Development / refurbishment | £73.65m | 3 |
| Investment / term refinance | £69.05m | 3 |
The development and refurbishment group includes construction, stabilisation and combined refinancing/refurbishment purposes. The investment and term refinance group concerns existing accommodation. The grouping describes the primary disclosed financing use; it is not an allocation of each pound to construction, capital works or debt repayment.[F1]
The lending opportunity extends beyond ground-up construction. Funding older stock through refurbishment and a new letting season can protect or reposition income. Development facilities need enough time for completion, mobilisation and stabilisation. In both strategies, the route to sustainable income determines the financing case.
Lender reports distinguish balances, commitments and new lending
Interim balance-sheet reports and facility announcements answer different questions. A closing loan balance reflects drawdowns, repayments and other movements. An announced commitment can include undrawn funds and does not establish how much cash reached the borrower during H1. Multi-sector lending capacity cannot be treated as PBSA lending.[F1]
The sample establishes financing activity across several student accommodation strategies. It does not support a reliable national H1 PBSA debt-origination total, lender market-share ranking or average loan margin. Counterparty names, individual deal values and identifying source links are retained in the private research record; the public figures are aggregated.[F1]
Lower valuations can tighten refinancing even before income falls.
Debt capacity depends on the asset’s valuation, sustainable income and the borrower’s capital structure.
Unite’s reported LTV increased during H1
See-through LTV excluding IFRS 16 leases; one operator, not a market average.
View chart data
| Metric | Dec 2025 | Jun 2026 |
|---|---|---|
| See-through LTV | 27% | 36% |
| Metric | December 2025 | June 2026 |
|---|---|---|
| See-through net debt | £1,744m | £2,552m |
| Average borrowing cost | 3.9% | 4.0% |
| Average debt maturity | 4.0 years | 3.6 years |
| Investment debt fixed | 100% | 94% |
Definitions follow the operator’s interim report.[O1]
Unite reported a 6.4% like-for-like property valuation decline at Unite’s share in H1. Debt rose through an acquisition and capital spending, with disposals providing a partial offset. An existing low-cost, hedged debt portfolio is not evidence that a new borrower can secure the same terms.[O1]
For lenders and sponsors, the practical response is to test refinancing against net achieved rent after incentives, realistic operating costs and an exit valuation supported by current comparables. Maturity headroom should cover the transition from construction into a demonstrable letting record.
Charges reveal financing structures, but do not measure loans advanced.
A screened cohort provides an observable record of security creation. Property-level corroboration is needed before treating a name match as a student accommodation financing.
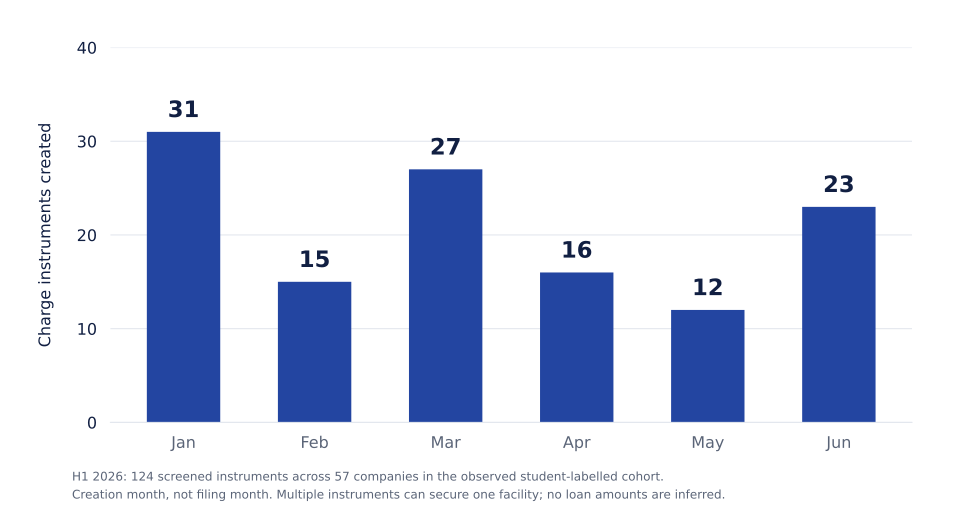
The local Companies House database returned 128 H1-created instruments across 61 companies using student-related company-name or collateral terms. Removing four clear non-property false positives leaves 124 instruments across 57 companies. This remains an exploratory cohort: most matches arise from company names, which do not prove student occupation of the collateral.[I1]
Security creation continued throughout the half
Monthly charge instruments in the screened cohort, by creation date. Not completed loan transactions.
View chart data
| Month | Charge instruments |
|---|---|
| 2026-01 | 31 |
| 2026-02 | 15 |
| 2026-03 | 27 |
| 2026-04 | 16 |
| 2026-05 | 12 |
| 2026-06 | 23 |
Only 10 retained records contain student wording in collateral particulars, and even that can refer to a tenant’s company name. Four instruments were created in H1 but delivered in July. Filtering by registration date would therefore move genuine H1-created security outside the period. The local snapshot is substantial, but it is not a verified sector census.[I1],[G1]
The private research record includes two asset-level checks between public facility announcements and registered security. These corroborate particular legal and property relationships, not the wider keyword cohort. The facility announcement supplies a stated amount; the charge record does not establish the loan advanced. Counterparty identities and matching keys are withheld from this public edition.[I1],[F1]
Several related property, land or operating entities can secure the same financing. Equally, a named security trustee or loan servicer may represent several economic lenders. Instrument counts, company counts and lender rankings cannot be substituted for verified financing deals.[I1]
The pipeline includes new capacity, renewal and alternative-use strategies.
Planning activity is broader than new supply. The distinction changes the finance opportunity and prevents administrative filings from inflating the market.
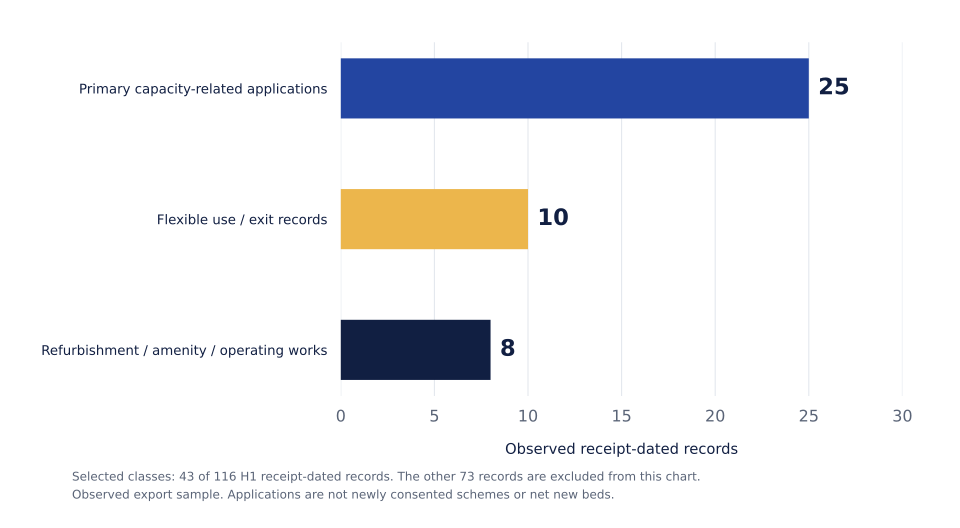
The audit considered 288 export files whose observation windows span H1, representing 188 authority labels. After deduplication by authority and application reference, 116 student/PBSA keyword records had receipt dates within H1. These are observed records in the lake, not complete national application coverage.[I1]
A keyword search contains several different financing signals
Selected activity classes within 116 H1-received records; applications and other record types are separated.
View chart data
| Classification | Observed records |
|---|---|
| Primary capacity-related applications | 25 |
| Flexibility / exit records | 10 |
| Refurbishment / amenity / operating works | 8 |
| Other records, separated from these activity classes | 73 |
| Strategy | Observed signal | Financing interpretation |
|---|---|---|
| University-estate renewal | Replacement or reconfiguration of existing accommodation. | Complex development and estate renewal. Existing capacity must be deducted before quoting net new beds. |
| New urban capacity | Applications proposing additional student accommodation. | Potential development propositions, not completed supply or committed financing. |
| Reuse of existing space | Proposals to convert existing buildings to student use. | Conversion and refurbishment funding, with building condition and operating viability central. |
| Alternative-use strategy | Proposals to allow or change to non-student accommodation uses. | Local asset-management choices; permission does not establish implementation or realised capacity change. |
Qualitative synthesis of the reviewed cohort. Individual scheme references, addresses and matching records are retained privately.[I1]
These records support a wider opportunity set: estate renewal, new schemes, conversions and improved utilisation of existing assets. They also challenge a simplistic assumption that every student-related application adds beds. No verified planning-application-to-charge join is asserted; similar locations alone do not prove that a scheme has secured debt.
The exports retain approved and pending records, not a full refused or withdrawn population. Generic residential unit and gross-development-value fields are not reliable PBSA bed or value measures. This report therefore does not calculate a national approval rate, development-finance conversion rate or aggregate PBSA gross development value.[I1]
Residential pricing provides local context for smaller acquisition strategies.
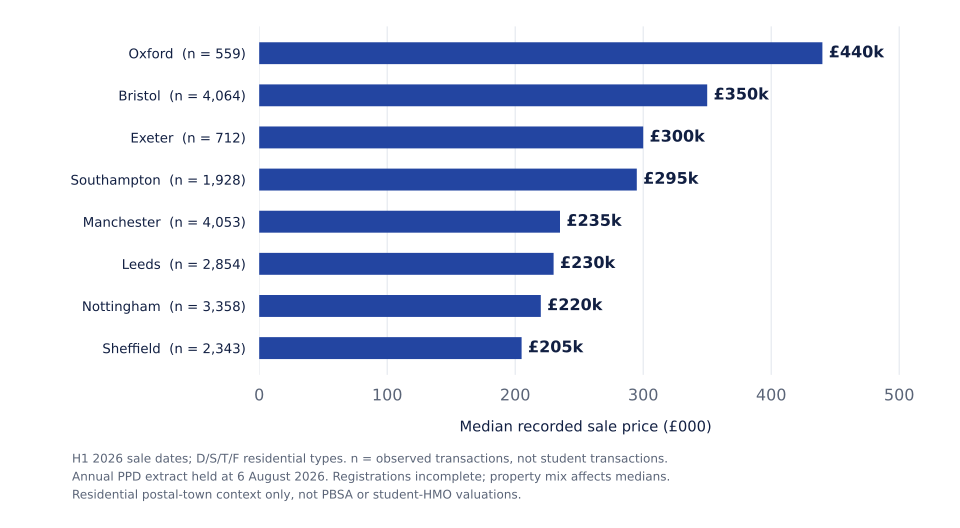
The sold data is used to compare local residential price levels and observed transactions. It is not presented as a student housing valuation index.
We selected H1-dated detached, semi-detached, terraced and flat sales across eight university postal towns from the SAF Land Registry data. The table shows observed sale counts, the all-type median and a terraced-house median. The housing mix and postal geography differ between markets.[I1],[G2]
Residential acquisition context varies across university markets
Observed H1 residential median price by postal town; not student HMO comparables or PBSA values per bed.
View chart data
| Postal town | Observed sales | Median price | Terraced median |
|---|---|---|---|
| Oxford | 559 | £440,000 | £436,500 |
| Bristol | 4,064 | £350,000 | £344,000 |
| Exeter | 712 | £300,000 | £270,000 |
| Southampton | 1,928 | £295,000 | £270,000 |
| Manchester | 4,053 | £235,000 | £210,000 |
| Leeds | 2,854 | £230,000 | £185,000 |
| Nottingham | 3,358 | £220,000 | £175,000 |
| Sheffield | 2,343 | £205,000 | £182,750 |
For a student HMO or conversion appraisal, these differences can inform initial acquisition assumptions and the choice of local comparables. They do not establish the value of a licensed student HMO. Street, bedroom count, condition, lawful use and rent evidence must be matched before a comparable informs credit or valuation.
Observed monthly counts are affected by registration delays, especially near the end of the available period. A low June count is not evidence of falling liquidity. The report does not compare these incomplete counts with a fully matured prior-year series, infer H1 price growth from cross-sectional medians, or count generic residential sales as student accommodation transactions.[I1]
Planning describes the proposed use and timing; Companies House identifies the legal security structure; sold records provide relevant property-market context. A verified finance or valuation conclusion requires a reliable asset or title match and an appropriate public disclosure. Postcode similarity or a student-related company name alone is insufficient.
Undergraduate momentum does not remove broader demand risk.
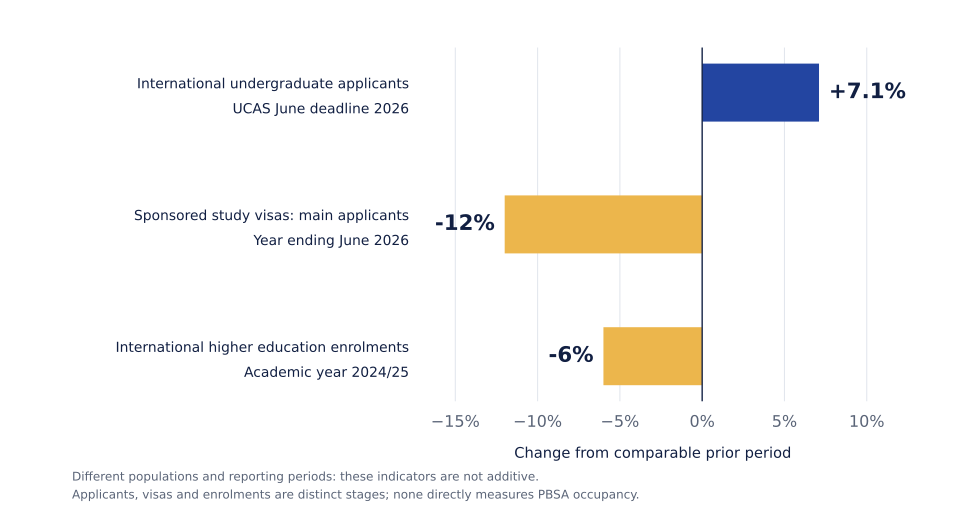
Different student cohorts are moving in different directions. The period and population behind each indicator are essential to interpretation.
Three demand signals, three distinct populations
Year-on-year change; observation periods differ. These series must not be added or treated as one index.
View chart data
| Indicator | Observation period | YoY change |
|---|---|---|
| International UCAS undergraduate applicants | June 2026 deadline | +7.1% |
| Main-applicant sponsored-study grants | Year ending June 2026 | -12% |
| International HE enrolments | Academic year 2024/25 | -6% |
UCAS recorded 695,740 applicants by the June deadline, 4.6% above 2025; international undergraduate applicants reached 148,350. By contrast, the Home Office recorded 365,868 main-applicant sponsored-study visa grants in the year to June, down 12%. UCAS does not cover postgraduate recruitment and gives only a partial view of international undergraduate admissions.[D2],[D3]
The latest HESA enrolment baseline available during H1 was academic year 2024/25: 2,863,180 UK higher education students, including 685,565 international students. Total enrolments fell 1% and international enrolments 6%. The total includes part-time students; dividing it by PBSA beds would not establish unmet housing demand.[D1]
Price point is part of demand underwriting. In Unipol’s 2025 survey, 76% of the 2,290 students who answered the accommodation-priorities question prioritised affordability. The full survey covered 2,637 continuing students across 37 universities. The survey is a pre-period behavioural signal, not a national housing-market share estimate.[S4]
Separate first-year domestic undergraduates, returning students, taught postgraduates and international cohorts. Check the property’s dependence on each group, course duration, university recruitment and the affordability of the all-in weekly price. An attractive studio can still face a shallow local market at its asking rent.
The wider sector needs several financing models.
A student HMO, a university hall and an institutional PBSA block can serve overlapping customers while carrying different operating and exit risks.
| Segment | Income and funding case | Key credit question |
|---|---|---|
| Stabilised private PBSA | Investment debt or refinance against sustained net operating income. | Are achieved rents, occupancy and operating costs resilient without excessive incentives? |
| Development PBSA | Development finance followed by stabilisation or investment debt; forward funding where executable. | Can the scheme open for the intended academic year with funded contingency and a credible exit? |
| University-owned halls / partnerships | Long-term capital partnerships, refurbishment finance and contract-backed structures. | What is the university covenant, and does the contract guarantee income or only nominate students? |
| Student HMOs and shared houses | Specialist buy-to-let, portfolio and refurbishment finance; local residential comparables can inform the property case. | Do licensing, tenancy arrangements, operating costs and student turnover support the debt? |
| Postgraduate studios and co-living / hybrid stock | Demand-specific investment or conversion strategy. | Does lawful occupation match the intended tenant mix, and is non-student use actually permitted? |
| Older stock and conversions | Capex-backed repositioning, development or bridging finance. | What is the net capacity change, cost of compliance and realistic stabilised income? |
Original financing analysis. The table is not a ranking of market returns or a set of lender term sheets.
University accommodation: covenant and contract before assumed security
The Office for Students reported that 35.8% of institutions in its England analysis had a deficit in 2024/25; 42.7% forecast one in 2025/26. This strengthens the rationale for capital partnerships in some cases while making counterparty assessment material. A nomination agreement should not automatically be underwritten as a lease guarantee.[S1]
Student HMOs: an established funding channel with different operating rules
For student HMOs, the financing assessment needs to address lawful use, licensing, tenancy arrangements and sustainable rental income. England’s first tenancy-reform phase took effect on 1 May 2026. Qualifying PBSA and mainstream student HMOs have different treatment; eligibility for student possession provisions and PBSA exemptions must be checked. Rules elsewhere in the UK differ.[S2],[S3]
For co-living and hybrid accommodation, a broader tenant pool is a business-plan proposition, not an automatic legal or demand advantage. Review consent, operator capability, room configuration and the evidence for each intended occupier group. No defensible separate H1 student co-living financing total was identified.
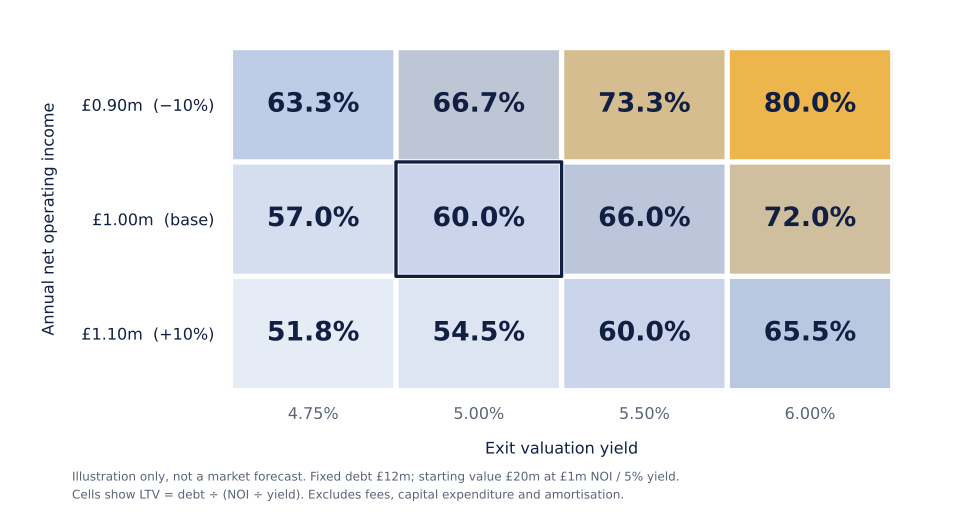
A modest income miss and yield shift can absorb the equity buffer.
The following sensitivity is an illustration, not a market forecast or lending offer. It isolates the mechanics of valuation and leverage.
Assume annual net operating income of £1.0m, a 5.0% valuation yield and £12.0m of debt. Capitalising income gives a £20.0m asset value and 60.0% LTV. Keep debt fixed. A 10% income reduction combined with a 5.5% yield produces a £16.36m value and 73.3% LTV.
The same £12m debt can move from 60% to 73% LTV
Illustrative LTV under alternative net operating income and valuation yields. Debt held constant.
View chart data
| Annual NOI | 4.75% yield | 5.00% yield | 5.50% yield | 6.00% yield |
|---|---|---|---|---|
| £0.9m | 63.3% | 66.7% | 73.3% | 80.0% |
| £1.0m | 57.0% | 60.0% | 66.0% | 72.0% |
| £1.1m | 51.8% | 54.5% | 60.0% | 65.5% |
If an illustrative refinancing lender caps LTV at 60%, the stressed asset supports £9.82m of debt. The borrower would need £2.18m to repay the existing £12.0m balance, before fees and any other funding needs. That is an equity requirement even if the building remains operational.
Interest coverage creates a second constraint. On £12.0m of interest-only debt, 6% annual interest costs £720,000: £1.0m NOI covers it 1.39 times. At £0.9m NOI and 7% interest, coverage falls to 1.07 times. Actual lender tests, hedging, amortisation and reserve requirements vary; none of these rates or limits is presented as an available quote.
A prudent facility links the development or refurbishment budget, operating ramp-up, interest reserve and refinance assumptions. Test a delayed opening, lower net rent and a weaker exit valuation together; a single-variable sensitivity can understate their combined effect.
A combined evidence base, with each measure kept in its proper scope.
The report uses public market and lender disclosures, Companies House records and the SAF proprietary planning and sold data lake. It does not treat those sources as interchangeable.
| Evidence | Measurement used | Limits |
|---|---|---|
| Agency investment reports | Completed investment transactions and reported capital values; Knight Frank is the principal series. | Investment is not borrowing. Corporate, asset, land and JV activity may have different treatment by publisher. |
| Lender announcements / interim reports | Gross facility amounts grouped by purpose; reports inform the distinction between balances and new business. | Counterparty-level source record retained privately. Announcements are not drawdowns; broader lender aggregates are not PBSA-only. |
| Companies House database | Unique security instruments by creation date; screened name / description cohort. | One financing can create several charges. Security agents are not always underlying funders. Metadata does not establish loan value. |
| Planning data lake | H1 received-date records; manual purpose classification and selected capacity proposals. | Applications are not starts; subsequent status is not status at 30 June. Administrative records and capacity losses are separated. |
| Sold data lake | Selected postal-town residential D/S/T/F transactions dated in H1; deduplicated. | Incomplete registration coverage; no verified student-use flag. Medians are local residential context, not PBSA values. |
| Demand and operator data | Academic-year, deadline and rolling-year indicators, with periods labelled. | Enrolments, applicants, visas, bookings and occupied beds are different populations. Operator guidance is not market actuals. |
The activity window is 1 January to 30 June 2026 inclusive. Publications available by 12 September that report H1 are admissible as retrospective evidence. Later observations are labelled as outlook updates. Property-use and company-name matching is screened for evident false positives; a record count is never converted into a lending value.[I1],[G1],[G2]
Calculations use source values before display rounding. There is no uplift for uncovered authorities, unknown loan amounts, missing student-use flags or delayed registrations. Public chart data and the detailed methodology accompany the report. Counterparty-level source extracts, matching records and reproducible analysis code are retained privately. Public downloads contain aggregates and methodology; they do not include the lender-to-borrower mapping.
The report’s market judgements and financing implications are original analysis. No probability weights, point forecasts for rents or lending volumes, or market-wide lender league tables are inferred from the available sample.
The next phase favours operational discipline over a broad market bet.
Our outlook for the remainder of 2026 is selective liquidity, with greater differentiation by affordability, university catchment, operator quality and the certainty of the financing exit.
Base case: income-producing assets with defensible net rents retain the clearest refinancing case. Refurbishment and repositioning can attract capital where a funded programme improves the asset’s affordability, quality or operating efficiency. Development remains executable where cost, timing and demand evidence justify the additional risk. This is an analytical scenario, not a forecast of market returns.
| Scenario | Evidence to watch | Financing implication |
|---|---|---|
| Upside | Applications convert into arrivals and lettings; incentives ease; valuation evidence stabilises; completions meet the academic window. | Better income visibility and debt coverage can widen the pool of executable refinances and developments. |
| Central | Demand varies by cohort and price point; pricing remains selective; funders distinguish strong assets from weak local propositions. | Finance is available, with conservative leverage, operating scrutiny and credible exits. |
| Downside | Weaker arrivals or university recruitment; higher incentives and costs; delayed openings; further valuation pressure. | More sponsor equity, longer stabilisation and selective restructuring may be required. |
Original scenarios; no probabilities assigned.
Post-period evidence reinforces caution. On 28 July, Unite guided to 94-96% occupancy for Unite Students and 88-90% for Hello Student in 2026/27. Those are operator forecasts. On 10 September, the Home Office reported 360,700 main-applicant sponsored-study applications in the year to August, down 16%; the series is provisional and extends beyond H1.[O2],[D4]
For investors, the priority is to pay for income that can be sustained after incentives, operating costs and necessary capital expenditure. For lenders, it is to fund a credible sequence from acquisition or construction through a completed letting cycle to repayment. For developers, the academic opening date and the affordability of the delivered product remain central underwriting variables.
Student accommodation continues to offer investable financing opportunities across PBSA, university partnerships, shared housing and refurbishment. The evidence supports selective deployment around proven local demand and robust capital structures. A national shortage narrative alone is an insufficient basis for leverage, pricing or a refinancing exit.
Sources & downloads
Source dates and observation periods are stated separately. Public disclosures are attributed to their publishers; database findings describe the observed extract.
- [M1]UK Student Market Update, Q1 2026
Knight Frank · 5 May 2026
Q1 investment transactions and indicative direct-let yields. Q1 investment value is rounded. - [M2]UK Student Market Update, Q2 2026
Knight Frank · 7 August 2026
Retrospective Q2/H1 transaction evidence; supply under construction is a later pipeline observation. - [M3]UK Living Market Dynamics, Q2 2026
JLL · 23 July 2026
Independent agency transaction series. The underlying web page is periodically updated. - [M4]£4.4bn transacted in the UK Living sector in H1
CBRE · 15 July 2026
Preliminary figures; the PBSA subset is £1.9bn, not the all-Living headline. - [O1]Unite Group interim results, six months to 30 June 2026
Unite Group · 28 July 2026
Company-specific see-through figures, excluding IFRS 16 leases for LTV. Acquisition changes comparability; see pp. 18-21. - [O3]Completion of Empiric Student Property acquisition
Unite Group · 28 January 2026
Primary confirmation that the corporate acquisition completed in Q1; not a Q2 transaction. - [O2]Interim results FAQs
Unite Group · 28 July 2026
2026/27 occupancy and rental growth figures used here are guidance as at publication, not H1 actuals. - [D1]UK higher education student numbers, 2024/25
HESA · 27 January 2026
Academic-year baseline. All HE students includes part-time students; overseas transnational education is not UK housing demand. - [D2]June deadline applicants: 2026 admissions cycle
UCAS · 16 July 2026
Observation cut-off 30 June 2026. Applicants are not enrolments or confirmed accommodation bookings. - [D3]Why do people come to the UK? Study
Home Office · 27 August 2026
Rolling year 1 July 2025 to 30 June 2026. Main-applicant sponsored-study grants, not H1 alone. - [D4]Monthly entry clearance visa applications: August 2026
Home Office · 10 September 2026
Post-period outlook update; provisional rolling-year applications to August 2026. - [S1]Financial sustainability of higher education providers in England 2026
Office for Students · 14 May 2026; corrected 15 June 2026
England regulated sector. Deficits reported in 2024/25 and forecasts for 2025/26 are different measures. - [S2]Renters’ Rights Act: an overview for landlords
UK Government · 1 May 2026
England only. Student HMO possession arrangements and qualifying PBSA treatment require case-specific eligibility checks. - [S3]Implementing the Renters’ Rights Act 2025
UK Government · Implementation roadmap; phase one 1 May 2026
PBSA exemption depends on qualifying conditions and approved code membership; not all student housing is exempt. - [S4]Student house-hunting behaviour survey 2025
Unipol · 5 September 2025
Pre-period survey: 2,637 continuing students across 37 universities; not a national market-share estimate. - [G1]Register a charge for a limited company
Companies House · Guidance accessed 12 September 2026
Registration follows creation; statutory filing window explains some month-boundary differences. - [G2]About HM Land Registry Price Paid Data
HM Land Registry · Guidance accessed 12 September 2026
England and Wales transaction coverage and exclusions. Generic property type is not a student-use classification. - [I1]H1 2026 database extraction and methodology
Student Accommodation Finance · Extracted 12 September 2026
Read-only analysis of Companies House and the proprietary planning/sold lake. Snapshot coverage, classification and deduplication documented separately. - [F1]H1 2026 financing sample: aggregate methodology
Student Accommodation Finance · Research cut-off 12 September 2026
Six verified lender/adviser announcements reviewed privately. The public report presents combined values; counterparty names, individual facilities and identifying source links are retained in the private research record.
The same evidence, cut for 41 university locations: Bath, Birmingham, Bournemouth, Brighton, Bristol, Cambridge, Camden, Canterbury, Cardiff, City of London, Colchester, Derby, Ealing, Exeter, Greenwich (Woolwich), Guildford, Hatfield, Hull, Islington, Kingston upon Thames, Leeds, Liverpool, Luton, Manchester, Newcastle upon Tyne, Newham (Stratford), Norwich, Nottingham, Plymouth, Portsmouth, Reading, Sheffield, Southampton, Southwark, Stoke-on-Trent, Sunderland, Swansea, Tower Hamlets, Westminster, Winchester, Wolverhampton.
Published by Student Accommodation Finance, a trading name of Lenzie Consulting Ltd. Original research and analysis, with public sources attributed to their publishers. This report is market commentary, not a valuation, personal investment recommendation or offer of finance. Illustrative scenarios are explicitly identified. Public-sector information is used with attribution; underlying source definitions and exclusions apply.